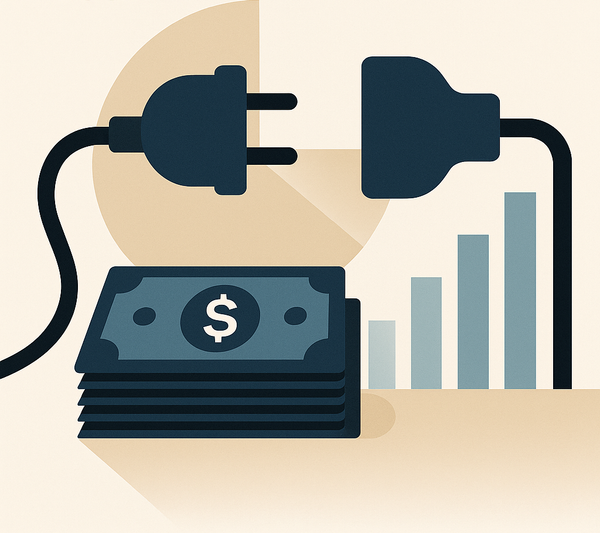
One Dashboard, Zero Surprises: Get Ahead of Renewals and Wasted Spend


More than half of all SaaS licences—53 %—now sit idle, draining an average of $21 million from the typical organisation every year (Zylo, 2025).
When those silent costs hit the card statement, the damage is already done. This playbook shows how proactive visibility, a clear renewal runway, and one well-structured dashboard turn hidden spend into recovered cash.
Key Takeaways
- Idle licences are the real sinkhole. Half of all seats go unused, yet 69 % of contracts auto-renew without review.
- Visibility creates leverage. Dashboards reveal waste early and give finance weeks to negotiate.
- Process beats heroics. A simple four-step workflow cuts 10–25 % of annual SaaS spend.
- StackCost turns process into habit with grouped projects, renewal alerts, and AI suggestions (availability varies by plan).
The Hidden Cost of “Set and Forget”
Most teams add tools faster than they can track them. The result is a spending black box.
Only 20 % of organisations have an effective usage-tracking system (LinkedIn Pulse, 2024). Without it, shadow IT flourishes: 80 % of employees admit to using unsanctioned apps (UserGuiding, 2025). Each new swipe of a corporate card piles on duplicate licences and forgotten trials.
Automatic renewals magnify the pain. Sixty-nine per cent of SaaS contracts roll over by default (BetterCloud, 2024). Once the renewal window closes, finance is stuck paying for another year—often at a higher tier. Vertice reports that renewal cycles take 50 % longer to negotiate than first-time purchases (Vertice, 2024). That is staff time nobody budgets.
Meanwhile, licensors raise prices: average SaaS spend jumped to $8 700 per employee in 2024 (Zylo), and market analysts expect the global SaaS market to climb from $317 billion in 2024 to $1.23 trillion by 2032 (Vena Solutions, 2025). Without a plan, the silent bleed only accelerates.
Summary: Reactive tracking guarantees overspend. The true cost of “set and forget” is both financial and operational: wasted cash, derailed budgets, and marathon renewal negotiations.
Visibility Changes the Game
Visibility is not a dashboard for its own sake; it is the foundation for smarter decisions.
First, knowing who uses what lets teams reassign or cancel idle seats before renewal day. Second, clear contract timelines mean procurement starts negotiations 60–90 days early, when vendors are still flexible. Third, finance can forecast spend trends instead of reacting to surprises.
“SaaS cost management is essential for maintaining financial control and making informed decisions about software investments.”
— Zluri (2024)
A well-designed view shows three data layers:
- Spend over time – month-on-month cost deltas reveal when a “temporary” seat ballooned into a premium tier.
- Usage vs. allocation – log-in counts mapped to licences expose redundant subscriptions.
- Renewal runway – contracts sorted by next renewal date, with traffic-light status.
StackCost provides these elements out of the box: its dashboards chart spend by project or team, while renewal alerts can be scheduled at 1, 3, 7, 14, or 30 days before each deadline—so every team can pick the lead-time that matches its approval cycle. (Free and Starter plans cover the basics; Teams and Org plans add forecasting)
Summary: When every stakeholder sees the same numbers in one place, clean-up shifts from a heroic sprint to a monthly habit.
Build a Smarter Cost-Tracking Stack
Case in Point: Turning a Design Concept into Spend Visibility
Product designer Harsha Varthini documented how her team built a SaaS-contract dashboard to consolidate vendor details, renewal dates, and spend trends in one view (Medium, 2024). The prototype quickly surfaced “orphan” subscriptions and gave finance a single place to review upcoming renewals — proof that even a lightweight dashboard can reveal hidden spend.
Their repeatable playbook:
- Inventory everything. Use a CSV import or card export to capture vendor, tier, cost, and renewal date.
- Assign owners. Every service needs a name next to it so questions have somewhere to land.
- Automate alerts. Schedule StackCost reminders at 1, 3, 7, 14, or 30 days before each renewal deadline.
- Review monthly. Compare usage to seats and decide: keep, reduce, or retire.
Each step is simple; together they create compound savings quarter after quarter.
Summary: A disciplined workflow, supported by the right tool, converts raw data into cancellation savings and stronger negotiation leverage.
From Inventory to Insights: How StackCost Accelerates the Journey
StackCost appears only four times in this article, yet its design underpins each framework step:
- Audit – Projects view groups services so finance and IT share context.
- Optimize – AI Service Alternatives (Starter plan and up) suggests cheaper tools by category.
- Govern – Renewal alerts (all plans) and role-based permissions keep every owner accountable.
- Report – Dashboards and CSV export feed finance models; Monte Carlo forecasting (Teams and Org) turns variable licences into predictable curves.
Because StackCost is manual-first, no API keys or direct integrations are needed. Teams adopt it in an afternoon, then refine over time.
Summary: Technology should remove friction from the process, not hide it. StackCost makes the cost-culture loop easy to start and hard to ignore.
Measure the Wins: What Visibility Unlocks
Once visibility is live, the CFO can move beyond anecdote to measurable outcomes:
| Metric | Before Dashboard | 6 Months After | Source |
|---|---|---|---|
| Idle seat percentage | 53 % | 35 % | Zylo, 2025 |
| Renewal negotiation time | 12 weeks | 6 weeks | Vertice, 2024 |
| Cost per employee | $8 700 | $7 400 | Zylo, 2025 |
| Shadow IT apps | 80 % unsanctioned usage | <50 % | UserGuiding, 2025 |
“Renewals take 50 % longer than first-time buys—the hidden tax nobody budgets for.”
— Nick Riley, Vertice (2024)
These gains compound: fewer idle seats today mean smaller renewals next year, which in turn free capital for growth projects.
Summary: Visibility pays off quickly and keeps paying off as the stack evolves.
Implementation Toolkit
| Step | Goal | StackCost Feature (Plan) | Owner | Checkpoint |
|---|---|---|---|---|
| 1 | Capture every service | CSV Import (Free) | Ops analyst | Day 7 |
| 2 | Group by project/team | Projects view (Free) | Team leads | Day 10 |
| 3 | Set renewal alerts | 30–90 day notifications (Free) | Finance Ops | Day 14 |
| 4 | Compare seats to usage | Manual input / upcoming integrations (Teams) | App admins | Day 21 |
| 5 | Present savings | Dashboards + Export (All plans) | CFO | Day 30 |
Conclusion
You cannot shrink what you cannot see. One centralised dashboard, paired with a monthly routine, turns silent overspend into budget headroom and negotiation power.
Ready to stop guessing? Try it free for 30 days.
FAQs
Q1 – I already track licences in Excel. Why switch?
Spreadsheets miss alerts, ownership, and historical snapshots. A purpose-built tracker automates those points so finance focuses on decisions.
Q2 – Who should own cost tracking in a small team?
Assign the role to someone close to both spend and usage—often an operations lead or technical project manager—but keep finance in the loop for policy.
Q3 – How often should we review services?
Run a quick monthly check for usage versus seats, and a deeper quarterly audit before major renewal seasons.